January 13, 2014
Epic EHR Case Study going live with and without Medical Scribes
Much of the talk in the EHR industry centers on the on the giant Epic EHR and their impressive portfolio. I personally spent four years documenting on Epic and can say it has some impressive components to it, however, in my opinion it was not built for the fast paced ED physician. When approaching new clients, we commonly warn C level executives about the potential productivity losses they will soon face with a un assisted rollout. This has a tendency to not carry much weight since the EHR vendors have promised so much in terms of gains. For us in the industry we know how and why medical scribes greatly increase productivity. But if you were on the fence before about scribes we’ve brought you this case study to illustrate their real power and benefit for your facility.
Let’s compare two hospitals the week they went live both using the same Epic EHR system. One facility went live with and the other without medical scribes. Both of these facilities are located in the state of Indiana and are part of the same health system. They also have very similar patient mixes and each was also previously using the “Gold Standard” voice dictation before going live on Epic.
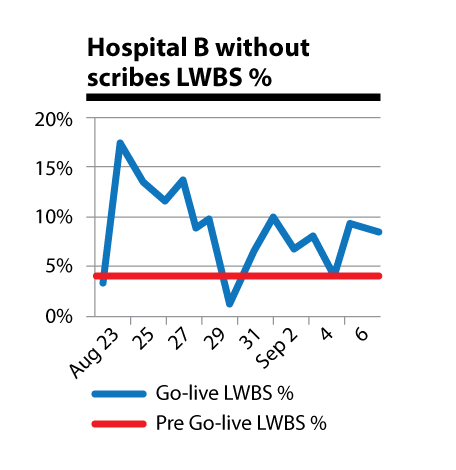
To start, let’s first take a look at the LWBS (left without being seen) statistic as a percentage for both hospitals. The charts below show the average LWBS before the go-live on Epic, and then how that percentage progressed after the new system was activated.
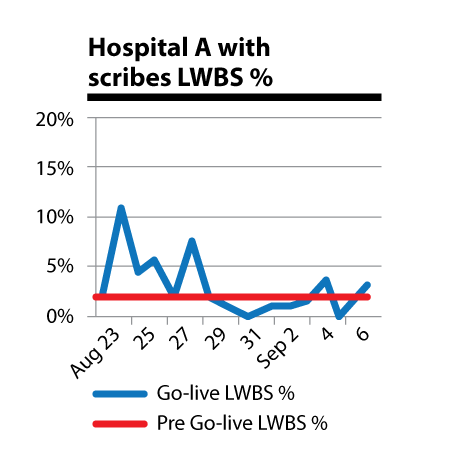
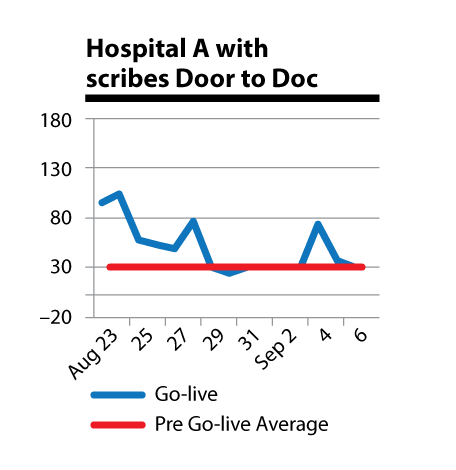
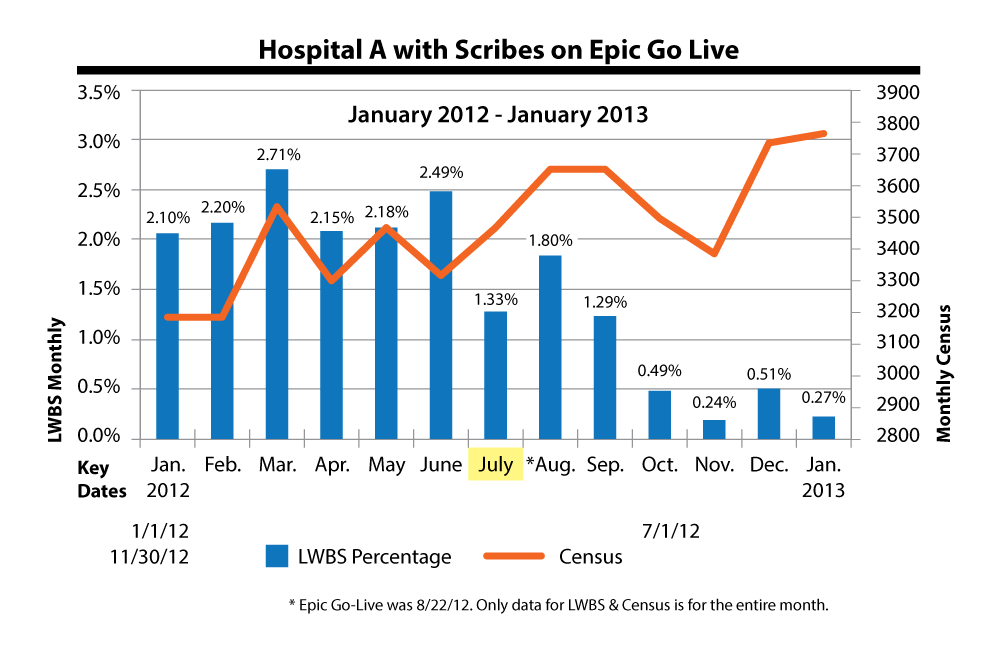
In the chart above, Hospital A, the one initially using scribes on their go-live date, pre Epic had LWBS as high as 2.71 percent. You can see that the LWBS percentage jumped up right after the go-live. Now with medicals scribes this hospital’s post Epic LWBS is 0.27 percent. It’s also important to know that additionally the volume here rose by 7,800 year to year, and door to provider time, which was initially 30 minutes, is now down to 10 minutes as described in the next set of charts.
Hospital B sadly fared much worse with their go-live. Their LWBS percentage jumped to almost 20 percent and stayed relatively high around, 10 percent, over the following week, with one exception around the end of August. But even after coming down from its highest point, the LWBS percentage was still persistently high for a facility that used to have a LWBS lower than five percent.
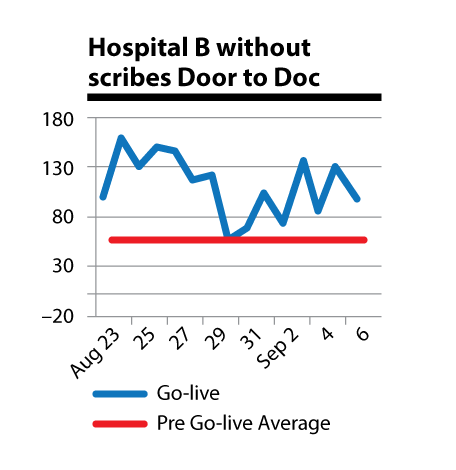
Hospital B faced similar challenges when it came to door to provider time as well after their go-live. Pre Epic the facility had about an hour for door to provider, but that jumped up to a high point of about two and a half hours during the go-live then down to a middle of about 90 minutes.
Now lets compare them both months later after both locations added scribes.
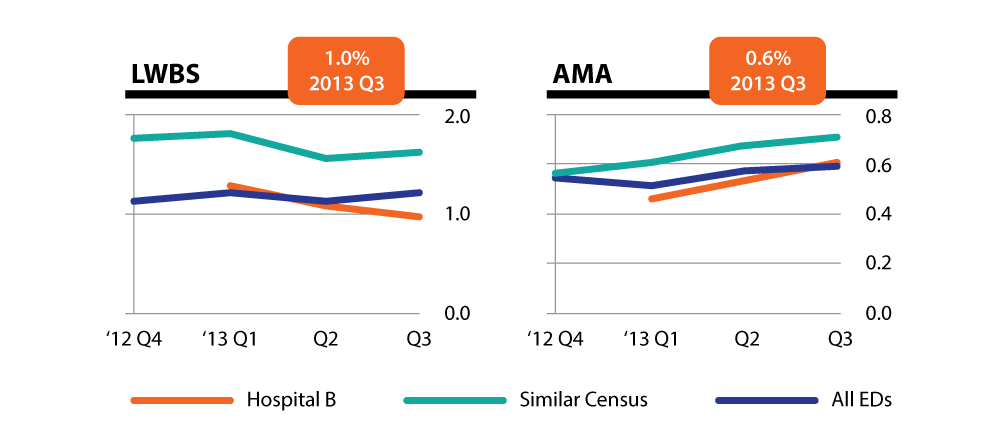
Above are some statistics from Hospital B after they added medical scribes. Before going live on Epic this facility had a LWBS of five percent. But now with the addition of medical scribes, their post Epic go-live LWBS is one percent. Which as you can see, according to the charts, is much less than similar emergency departments and all ED’s as a whole.
In the second chart here, also from Hospital B, the percentage of patients leaving the ED AMA (against medical advice) increased along with the number for the industry as a whole. However that increase was only by 0.6 percent and much lower than the national rate.
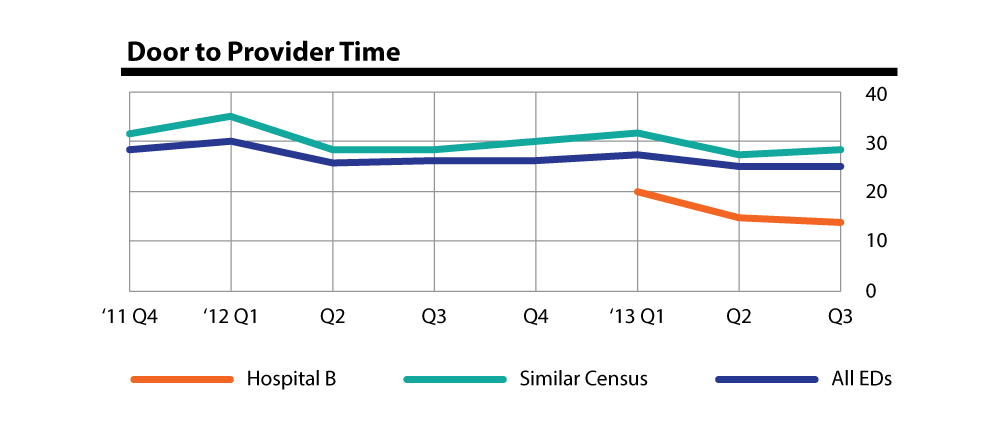
Door to Provider Assigned
A similar trend as described above with LWBS and AMA numbers can be seen for Hospital B above with door to provider time. Pre go-live it was at 50 minutes, now it stands at an impressive 13 minutes.
Finally below you can see the statistics for Hospital A which went live on an Epic EHR system with medical scribes. The monthly LWBS percentage had held steady for a time around 2.1 to 2.71 percent, but as the implementation of the Epic EHR system took place you can see that the LWBS percentage declined and has stayed down, even as monthly census volume increased nearly 25%.
Conclusions
As you can see from the data here, there is little doubt that medical scribes make the transition to an EHR system much smoother than it otherwise would be. But the benefits do not stop there, over time as demonstrated here, medical scribes are able to increase facility productivity to levels even better than before the EHR implementation.